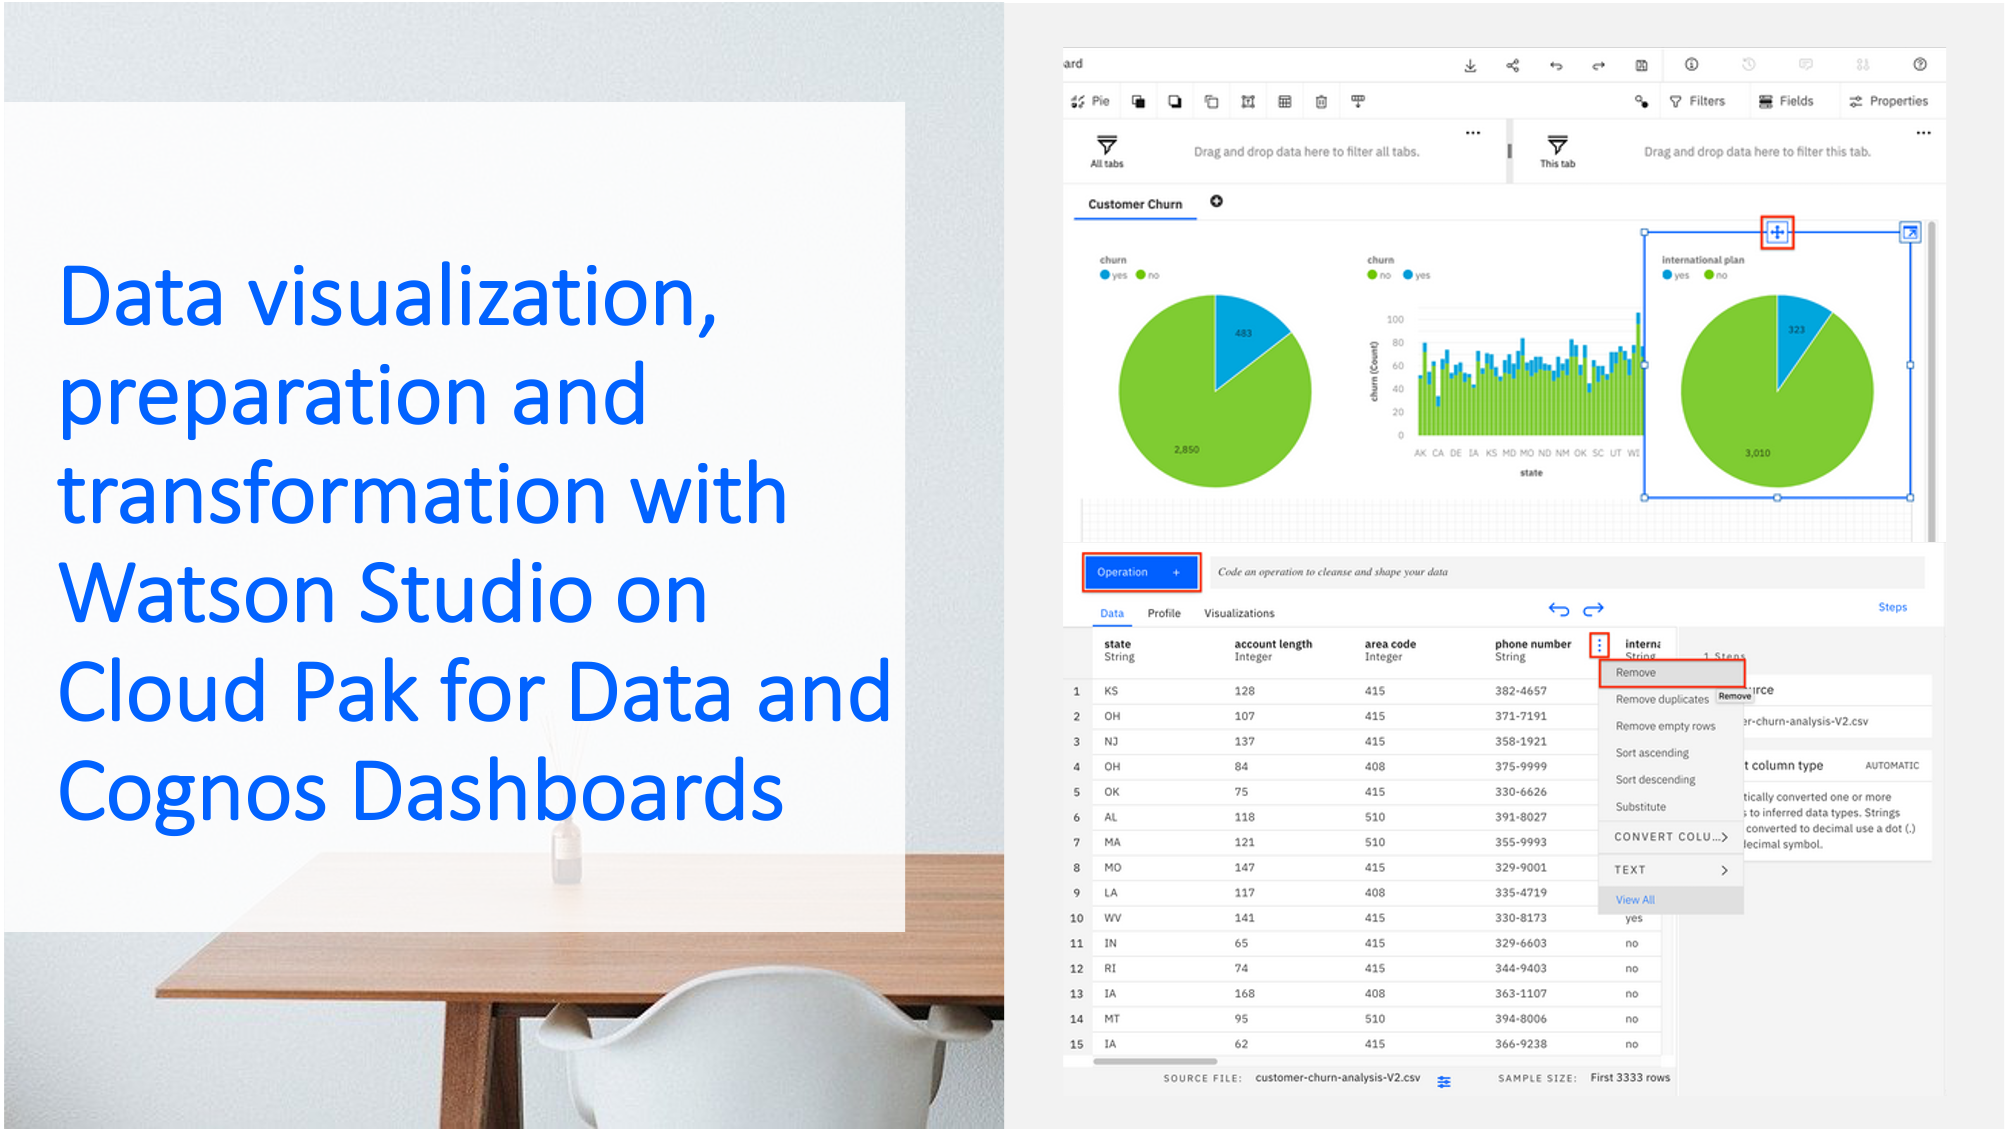
In this hands-on tutorial you will perform data visualization, preparation, and transformation to build a high-quality predictive model for customer churn.
If you don’t have one already, please Sign up for an IBM Cloud account.
This tutorial consists of 6 parts, you can start with part I or any other part, however, the necessary environment is set up in part I.
Part I – data visualization, preparation, and transformation
Part II – build and evaluate machine learning models by using AutoAI
Part III – graphically build and evaluate machine learning models by using SPSS Modeler flow
Part IV – set up and run Jupyter Notebooks to develop a machine learning model
Part V – deploy a local Python app to test your model
Part VI – monitor your model with OpenScale
Set up your environment
In your IBM Cloud account, you can either set up the services – Cloud Object Storage (COS), Watson Studio and Watson Machine Learning (WML) – individually in the Cloud catalog or you can set up you Cloud Pak for Data as a Service, which takes you through a process of setting up these services.
- To set up the services individually in the Cloud catalog click here: https://cloud.ibm.com/catalog
- To set up Cloud Pak for Data as a Service click here: https://dataplatform.cloud.ibm.com/
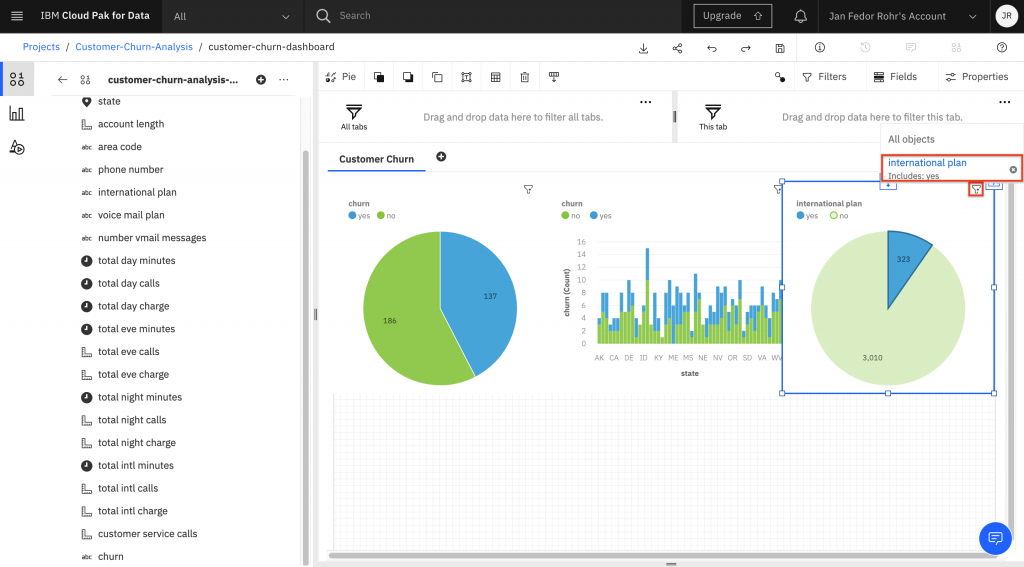
Data visualization
In your Watson Studio project settings you can add the Cognos Dashboard Embedded service. With Cognos Dashboards you can add all kinds of data sources and generate dynamic visualizations. With the customer churn data you can for instance create a visualization that shows the ‘International Plan’ and ‘Customer Churn’ in a pie chart, as well as ‘Churn by state’ in a stacked diagram. When you click the slice associated with the value churn ‘yes’, a filter is created that will apply to all other (connected) visualizations on your dashboard. Furthermore, you can generate shared links to share your dashboard with others.
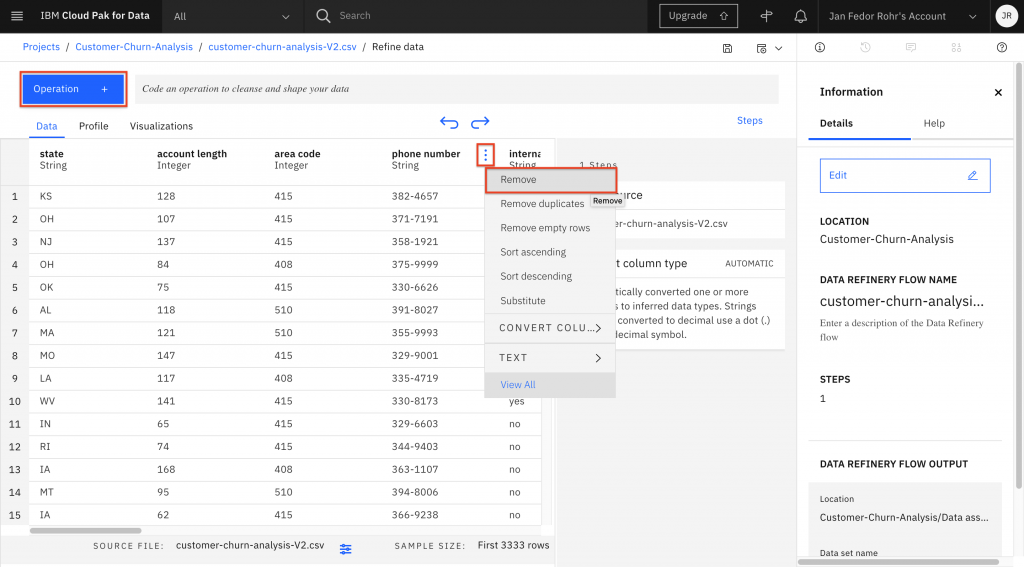
Data preparation and transformation
Watson Studio offers a service called Data Refine that lets you clean up and transform data without any programming. You can add a Data Refinery flow by clicking the add button or simply select your data set and click the Refine button. During the Refine process you can click the Operation button in the upper-left corner, which shows you some available transformations. This is how you can prepare you data for the next step, to create Machine Learning models.
To access the complete tutorial go to this GitHub Repository.